The shape of the lesson
By the end of the lesson, learners can
- distinguish random and systematic errors and state how each can be reduced
- distinguish precision and accuracy
- find the absolute, fractional and percentage uncertainty in a measurement
- estimate the uncertainty in a reading from an instrument and from repeated readings
- combine uncertainties for sums and differences, products and quotients, and powers
- express a result as a value plus or minus an uncertainty to an appropriate number of significant figures
Key vocabulary
random error, systematic error, precision, accuracy, absolute uncertainty, fractional uncertainty, percentage uncertainty, resolution, half the range. Each term is introduced as it is first needed.
Two distinctions, then the arithmetic
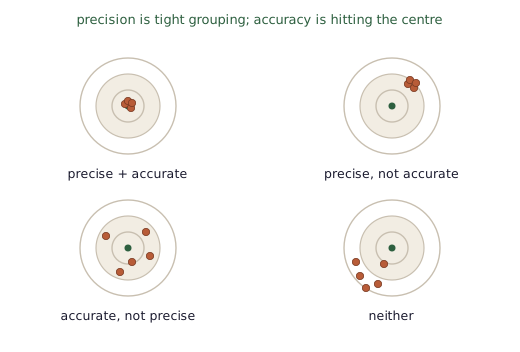
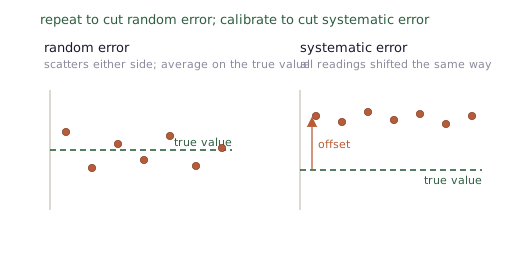
The lesson rests on two distinctions that learners routinely blur: random versus systematic error, and precision versus accuracy. The four target boards make the second concrete, and a pair of scatter plots makes the first visible: random error scatters readings either side of the true value, while a systematic error shifts every reading the same way.
Finding and combining uncertainties
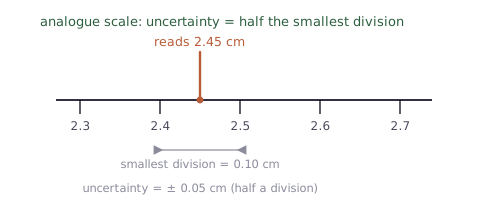
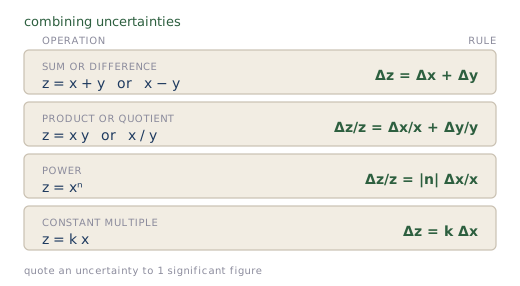
A reading carries an uncertainty: half the smallest division on an analogue scale, the resolution on a digital display, or half the range over repeated readings. When quantities are combined, the uncertainties follow a small set of rules, and the final uncertainty is quoted to one significant figure.
Sixty minutes, phase by phase
| Time | Phase | What happens in the room | Resources |
|---|---|---|---|
| 0 to 5 min | Starter | Show two sets of repeated readings, one scattered and one tightly grouped but offset; ask which is better. Learners argue precise versus accurate. | Slide 1, fig-accuracy-precision |
| 5 to 17 min | Teach: errors | Define random and systematic error and precision and accuracy, linking each to how it is reduced. Learners classify given scenarios. | Slides 2 to 5, fig-random-vs-systematic |
| 17 to 30 min | Teach: combining | Introduce absolute, fractional and percentage uncertainty and the combining rules; model the two worked examples, keeping the units explicit. | Slides 6 to 10, fig-uncertainty-combine |
| 30 to 50 min | Activity | Rally Coach on the problem set: one partner solves aloud, the other coaches and checks each step, then they switch. | Rally Coach activity sheet |
| 50 to 60 min | Plenary | Exit ticket, then review the rule that is most often misapplied. | Exit ticket slide |
A product and a quotient
Example 1: a product
A wire has length L = 2.00 ± 0.01 m and diameter d = 0.50 ± 0.01 mm. Find the percentage uncertainty in the cross-sectional area A = π d2 / 4.
Example 2: a quotient
A density is found from ρ = m / V, with m = 50.0 ± 0.1 g and V = 20.0 ± 0.5 cm3. Find ρ and its uncertainty.
Rally Coach
Pairs share one problem set. For the first problem, partner A is the solver and partner B is the coach: the solver works the problem out loud while the coach watches, praises correct steps, and questions any step that looks wrong. They switch roles for the next problem, and continue alternating through the set. A full step-by-step facilitation guide, with the six-problem set and a teacher answer key, is provided as the activity in this bundle, so it can be run faithfully, including by a cover teacher.
Why it suits this lesson. Uncertainty work is procedural and error-prone, so immediate feedback matters. Rally Coach gives every learner a coach at their elbow on alternate problems, catching a misapplied rule the moment it appears rather than at marking.
What to head off, and how
| Trap learners fall into | Teaching move that pre-empts it |
|---|---|
| Believing more readings remove a systematic error. | Averaging reduces random scatter only. A systematic shift stays in the mean; reduce it by zeroing or calibrating. |
| Treating precise and accurate as the same. | Readings can be tightly grouped (precise) yet all wrong (not accurate). Use the four target boards to hold them apart. |
| Adding percentage uncertainties for a sum or difference. | For sums and differences, add the absolute uncertainties. Percentages are added only for products and quotients. |
| Quoting an uncertainty to several significant figures. | An uncertainty is normally given to one significant figure, with the value matched to the same decimal place. |
Support, challenge and the checks
- Support: the combining-rules card and a part-worked example with the final step left for the learner.
- Challenge: combine three quantities, including a power, and decide the correct number of significant figures for the final uncertainty.
- Language: rehearse the frames "this is a random error because ..." and "for a product I add the percentage uncertainties" before learners write.
Assessment is formative. Exit ticket question 1: a current I = 2.0 ± 0.1 A flows through R = 10.0 ± 0.5 Ω; find V = I R and its absolute uncertainty. Exit ticket question 2: readings cluster tightly but all lie 5 percent above the true value, are they precise, accurate, both or neither, and what is the likely error? Circulating during Rally Coach gives a quick read on which rule needs another pass.
Equipment and resources
- the Rally Coach problem set and the worksheet from this bundle
- a combining-rules card for support, and the exit ticket from the final slide
- the site simulation Accuracy and Precision, and the student topic page Errors and uncertainties