From a speed-time graph, state how you would find (a) the acceleration, and (b) the distance travelled.
The speed-time graph below shows a journey. Use it for Q2 to Q4.
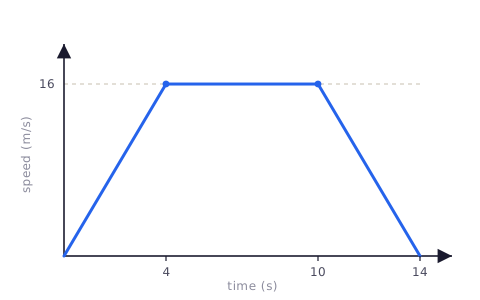
(a) Calculate the acceleration during the first 4 s. (b) Describe the motion between 4 s and 10 s.
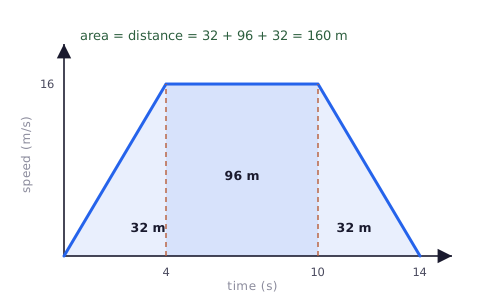
Calculate the total distance travelled, by finding the area under the line. Show how you split the area.
Calculate the deceleration during the last 4 s.
A car accelerates uniformly from 5 m/s to 25 m/s in 8 s. Calculate its acceleration.
A train travels at a constant 30 m/s for 40 s. Use the area under its speed-time graph to find the distance travelled.
Total: 15 marks. Original work by the TheLucidSTEM team. Written in the style of the papers; no past paper question is reproduced.
Answer key · full worked solutionsclick to reveal
(a) the acceleration is the gradient of the line (use a large triangle, a = Δv ÷ Δt).
(b) the distance travelled is the area under the line.
(a) a = Δv ÷ Δt = 16 ÷ 4 = 4 m/s².
(b) between 4 s and 10 s the line is horizontal at 16 m/s: constant speed.
split into a triangle, a rectangle and a triangle:
triangle (0 to 4 s): ½ × 4 × 16 = 32 m.
rectangle (4 to 10 s): 6 × 16 = 96 m.
triangle (10 to 14 s): ½ × 4 × 16 = 32 m.
total distance = 32 + 96 + 32 = 160 m.
a = Δv ÷ Δt = (0 − 16) ÷ 4 = −4 m/s², so the deceleration is 4 m/s².
a = Δv ÷ Δt = (25 − 5) ÷ 8 = 20 ÷ 8 = 2.5 m/s².
distance = area = 30 × 40 = 1200 m.