The shape of the lesson
By the end of the lesson, learners can
- distinguish distance from displacement and speed from velocity
- define acceleration as the rate of change of velocity
- distinguish average and instantaneous values of velocity and acceleration
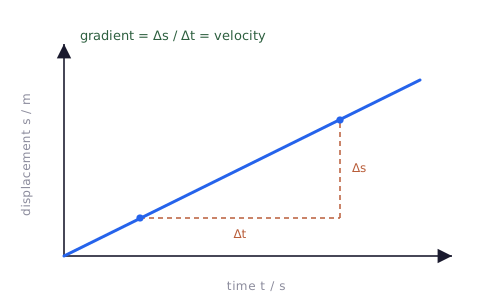
- find velocity from the gradient of a displacement-time graph
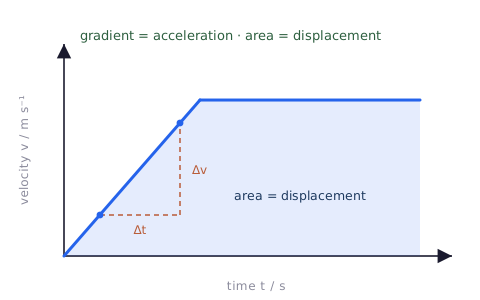
- find acceleration from the gradient, and displacement from the area, of a velocity-time graph
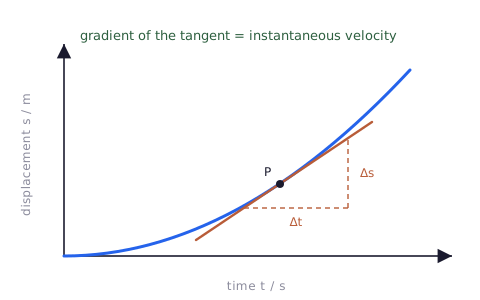
- find an instantaneous velocity from the gradient of a tangent to a curve
Key vocabulary
distance, displacement, speed, velocity, acceleration, average, instantaneous, gradient, area, tangent. Each term is introduced as it is first needed.
Five quantities, two of them vectors
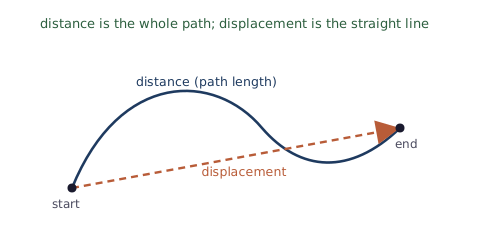
Distance and speed are scalars; displacement, velocity and acceleration are vectors, and the difference is what trips learners up. A there-and-back journey has a large distance but a small displacement, and a negative velocity means a direction, not a slowing down.
| Quantity | Meaning | Type |
|---|---|---|
| distance | total path length travelled | scalar |
| displacement | straight-line distance and direction from start to end | vector |
| speed | distance per unit time | scalar |
| velocity | displacement per unit time (a direction is needed) | vector |
| acceleration | rate of change of velocity, a = Δv / Δt | vector |
Reading motion graphs
The whole skill is reading a graph: the gradient of a displacement-time graph is the velocity, while on a velocity-time graph the gradient is the acceleration and the area is the displacement. On a curve, the gradient at an instant comes from the tangent at that point.
Sixty minutes, phase by phase
| Time | Phase | What happens in the room | Resources |
|---|---|---|---|
| 0 to 5 min | Starter | A there-and-back walk; learners give the distance and the displacement and explain the difference. | Slide 1, fig-distance-displacement |
| 5 to 17 min | Teach: quantities | Define the quantities; contrast average and instantaneous; define acceleration. Learners classify each as scalar or vector. | Slides 2 to 5 |
| 17 to 30 min | Teach: graphs | Build displacement-time and velocity-time graphs; show gradient and area; take a tangent. Learners read a velocity from a gradient and a displacement from an area. | Slides 6 to 10, fig-st-graph, fig-vt-graph, fig-tangent |
| 30 to 50 min | Activity | Corners: learners move to the corner (at rest, constant velocity, speeding up, slowing down) that matches each graph or motion, then defend it. | Corners activity sheet, four corner labels |
| 50 to 60 min | Plenary | Exit ticket, then review the round that split the class. | Exit ticket slide |
A journey and a graph
Example 1: distance and displacement
A runner travels 300 m east then 100 m west, taking 25 s in total. Find the distance, the displacement, the average speed and the average velocity.
Example 2: a velocity-time graph
An object speeds up from rest to 20 m s−1 in 4.0 s, then moves at 20 m s−1 for 6.0 s. Find the acceleration in the first phase and the total displacement.
Corners
Four corners of the room are labelled at rest, constant velocity, speeding up and slowing down. The teacher shows a graph or reads a motion, and each learner physically moves to the corner they believe matches. Same-corner learners build the strongest reason for their choice; corners then challenge each other, and learners may switch if convinced. A full step-by-step facilitation guide, with the corner labels, the rounds and a teacher answer key, is provided as the activity in this bundle, so it can be run faithfully, including by a cover teacher.
Why it suits this lesson. Motion graphs hide several misconceptions, and learners often pick an answer without committing. Physically choosing a corner forces a public commitment, so no learner stays undecided, and each must be ready to justify the choice.
What to head off, and how
| Trap learners fall into | Teaching move that pre-empts it |
|---|---|
| Treating distance and displacement as the same. | They are equal only for motion in a straight line with no reversal. Use the there-and-back walk to separate them. |
| Reading a negative velocity as slowing down. | A negative sign shows direction; the speed falls only when the speed value decreases. |
| Confusing the two graph types. | Name the axes first: gradient of a displacement-time graph is a velocity; gradient of a velocity-time graph is an acceleration. |
| Thinking zero acceleration means at rest. | Zero acceleration means constant velocity, which may be a large constant velocity. |
Support, challenge and the checks
- Support: a paired set of motion descriptions and graph sketches to match before the Corners rounds.
- Challenge: sketch the velocity-time graph that matches a given displacement-time curve, and explain the link between the two.
- Language: rehearse the frames "the gradient here is the ..." and "it is constant velocity because ..." before learners commit.
Assessment is formative. Exit ticket question 1: a car speeds up from 5.0 m s−1 to 25 m s−1 in 8.0 s, find its acceleration. Exit ticket question 2: a velocity-time graph is a horizontal line at 12 m s−1, state the acceleration and describe the motion. The public commitment in each Corners round gives a quick read on individual understanding.
Equipment and resources
- the four corner labels and the Corners rounds, and the worksheet from this bundle
- a graph-matching support set, and the exit ticket from the final slide
- the site simulation Graphs of Motion, and the student topic page Linear motion and graphs