The shape of the lesson
By the end of the lesson, Extended learners can
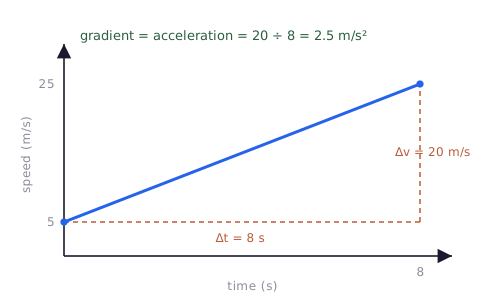
- determine an acceleration from the gradient of a speed-time graph, using a large triangle
- treat a deceleration as a negative acceleration, shown by a line that slopes down
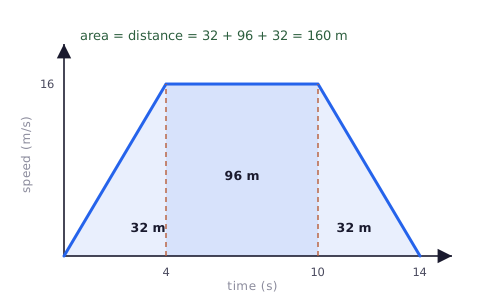
- determine the distance travelled from the area under a speed-time graph
- split the area under a speed-time graph into triangles and a rectangle, find each, and add them
- solve a multi-step problem that combines a gradient and an area on one graph
Key vocabulary
gradient, acceleration, deceleration, area under a graph, triangle, rectangle, trapezium, large triangle, metre per second squared. Each term is introduced as it is first needed.
Two readings from one line
The unit shares one picture, the twin-graph poster, and this lesson turns its speed-time side into calculations. Two readings come from the same line: the gradient is the acceleration, found with a large triangle as a = Δv ÷ Δt, and the area under the line is the distance travelled, found by splitting the shape into a triangle and a rectangle and adding them. The simulation Distance from a Speed-Time Graph lets learners shape an area to match a true distance, while Acceleration from a Velocity-Time Line shows the gradient side.
Forty-five minutes, phase by phase
| Time | Phase | What happens in the room | Grouping |
|---|---|---|---|
| 0 to 5 min | Hook: match it | The site simulation Distance from a Speed-Time Graph runs on the board: learners shape an area to match a true distance. The companion Acceleration from a Velocity-Time Line shows the gradient side. The question: what do the gradient and the area each tell us? | Whole class, sim on board |
| 5 to 16 min | Build the methods | Two methods are modelled on one journey: the acceleration is the gradient, found with a large triangle, a = Δv ÷ Δt, and a negative gradient is a deceleration; the distance is the area under the line, found by splitting it into a triangle and a rectangle and adding them. | Whole class, teacher led |
| 16 to 30 min | Pairs Check | In pairs, one partner solves a gradient-or-area problem aloud while the other coaches and checks, then they swap. After every two problems the two pairs in a four compare answers. The full facilitation is in the activity materials in this bundle. | Pairs within fours |
| 30 to 40 min | Gallery Walk | Each group displays one worked solution. Groups walk the room, leaving a star and a question on each, then return to read the feedback on their own. The activity materials give the full method. | Groups, moving |
| 40 to 45 min | Plenary and exit | Exit ticket: from one speed-time graph, find an acceleration from the gradient and a distance from the area. Learners self assess against the objectives. | Individual |
Two structures, one clock
Two cooperative structures run back to back here, so watch the clock. Pairs Check carries the practice; the Gallery Walk is the lighter review and is the first to be trimmed.
Protected: the exit ticket. It is the only individual check of the Extended outcomes and is not cut.
If time is short: shorten the Gallery Walk so groups view just two posters, or replace it with a single whole-class review of one strong solution.
In a 60 minute block: capture a speed-time graph from a data logger on a ramp, then find the acceleration from the gradient and the distance from the area.
Pairs Check, then a Gallery Walk
In Pairs Check, one partner solves a problem aloud while the other coaches and checks, then they swap; after every two problems the two pairs in a four compare answers. In the Gallery Walk, each group displays one worked solution, the class walks the room leaving a star and a question on each, and groups return to read the feedback. A full step-by-step facilitation guide, with the problem set, the gallery task, sentence stems, a teacher script and the answer key, is provided as the activity in this bundle, so both structures can be run faithfully.
Why it suits this lesson. Gradient and area are procedures best learned by doing, coaching and checking, which is exactly Pairs Check. The Gallery Walk then exposes learners to different correct layouts and common slips, which deepens the method.
What to head off, and how
| Trap learners fall into | Teaching move that pre-empts it |
|---|---|
| Reading the gradient from two close points, or dropping the unit. | Use a large triangle that spans most of the line, and give the acceleration in m/s². |
| Thinking the area gives the speed. | The area under a speed-time graph is the distance travelled, not the speed. |
| Not splitting the area into simple shapes. | Split the area into a triangle and a rectangle (and another triangle), find each, then add. |
| Forgetting that a deceleration is negative. | A line sloping down has a negative gradient, so the acceleration is negative: a deceleration. |
| Using a distance-time method here. | On a distance-time graph the gradient is the speed. This is a speed-time graph: gradient is acceleration, area is distance. |
Support, challenge and the checks
- Support: pre-drawn axes with a worked gradient triangle, and an area already split into a triangle and a rectangle to complete.
- Challenge: a graph with two different gradients to compare, and an area that needs three shapes, including a return to rest.
- Language: rehearse "the gradient is the acceleration" and "the area is the distance" so the two readings are never confused.
Assessment is formative. Pairs Check makes each learner both solve and coach; the Gallery Walk surfaces alternative layouts and errors; and the exit ticket maps to the Extended outcomes, a gradient and an area from one graph.
Equipment and resources
- graph paper, rulers, mini whiteboards, and chart paper with sticky notes for the Gallery Walk
- the Pairs Check activity (with its facilitation guide), the worksheet and the exit ticket from this bundle
- the site simulations Distance from a Speed-Time Graph and Acceleration from a Velocity-Time Line; the student topic pages Motion graphs and Acceleration